
In Part 1, we questioned the fundamental principles said to underpin “the Climate Science™.” Specifically, we considered the scientific validity of the supposed “consensus” and explored some of the many scientific doubts expressed about Anthropogenic Global Warming (AGW) theory and the so-called “greenhouse effect.”
We noted the contradictory layman’s explanation of AGW theory offered by some climate scientists. And we noted that this apparent lack of basic knowledge should not simply be dismissed and then ignored.
Believing and implementing the AGW theory has dire consequences. “The” climate science, as it is called, is being exploited by a global public-private partnership as a justification for transforming the world. That being the case, the least we can expect is that these self-described climate scientists understand their own theory.
With the 2023 publication of a series of policy briefs called Our Common Agenda, the United Nations (UN) announced that questioning “the Climate Science™” is tantamount to hate speech. As we discussed in Part 1, the legacy media has already adopted editorial policies that rule out any possible questioning of the climate science orthodoxy. Thus, the internet is an important remaining public square where people can still ask questions.
The UN is clearly worried that the fraudulence of the AGW theory will be exposed via the internet. Thus, the UN asserts that all climate scepticism expressed online must be censored:
The impacts of online mis- and disinformation and hate speech can be seen across the world, including in the areas of health [and] climate action. [. . .] A small but vocal minority of climate science denialists continue to reject the consensus position. [. . .] Strengthening information integrity on digital platforms is an urgent priority for the international community. [. . .] [M]easures that limit the impact of mis- and disinformation and hate speech will boost efforts to achieve a sustainable future.
In the above comment, the UN ignored the fact that many of the people it calls “climate science denialists” are in fact scientists—and that among their ranks are climate scientists. By this deliberate omission and by misrepresenting anti-scientific statements about “consensus” as scientific arguments, the UN is spreading disinformation around the globe.
The purpose of these articles—Parts 1, 2 and 3—is to stimulate open and honest debate about climate change and climate science. They are not offered as conclusive rebuttals of the prevailing climate science. Based upon the inspiring PhD dissertation of Rob Jeffrey, they simply provide a limited record of some of the reasons to question the prevailing climate science and the climate change narratives we are all asked—by the UN and other globalist organizations—to unquestioningly accept.
Because these three articles build upon one another, we ask that you please read Part 1 first, so you can fully grasp the arguments made here, in Part 2.
Questioning AGW Theory Experimental Proof
The AGW theory paper Halpern et al. (2010) clarified that the naming of the “greenhouse effect” was misleading because the proposed AGW related mechanism is nothing like the process that keeps the atmosphere warm in a greenhouse:
Concisely, greenhouses work by restricting the outward flow of thermal energy to the surrounding atmosphere by convection, while the atmospheric greenhouse effect works by restricting the outward flow of thermal energy to space by radiation.
Wherever possible, science generally proves theories through repeatable experiments that consistently produce results that evidence the theory.
Based on the 1856 published theories of Eunice Foote, in 1859 John Tyndall conducted his famous experiment to show how CO2 absorbs and transmits radiant heat. This is often cited as experimental proof of the “greenhouse effect.” But Tyndall’s experiment did not demonstrate the claimed greenhouse effect.
In order to have done that, Tyndall would have needed to show a temperature gain in the emitting and absorbing objects. But Tyndall didn’t even measure that. Instead, he demonstrated that thermal energy radiates from a warm body to a colder one and measured the comparative electromagnetic radiation absorption properties of various gases.
Other experiments, too, are claimed to be proof of the greenhouse effect. In 2020, the Royal Society conducted an experiment in which they qualitatively illustrated climate change mechanisms. They placed a heating element, set to 50°C, inside balloons inflated to various fixed pressures filled either with air or pure CO2. They then switched the element off and observed how long it took to cool. The researchers noted that the cooling rate was much lower in the CO2-filled balloons.
But this was not a demonstration of the “enhanced greenhouse effect” suggested by proponents of AGW theory. Without any additional energy supplied to the system, AGW theory claims that if a constant power supply were maintained to the heating element, so-called “back” radiation from the CO2 would increase its temperature. Thus, the Royal Society experiment certainly did not prove AGW theory or the alleged physical mechanism of “global warming.”
Gasses trapped in balloons at fixed or constrained pressures behave nothing like the actual freely expanding and contracting gasses in Earth’s atmosphere. Nor is pure CO2 comparable with atmospheric CO2 levels. In the atmosphere, the CO2 would cool by expansion and adiabatic lapse. It couldn’t do that in the pressurised balloon. So this experiment did not demonstrate the alleged greenhouse effect.
Other so-called greenhouse gas theory proofs are equally inconclusive. Nature published a paper that supposedly quantified the atmospheric greenhouse effect using satellite readings to measure the infrared radiation energy trapped by atmospheric gases and clouds. Having done so, the climate scientists then claimed this provided compelling evidence of atmospheric “positive feedback”— in this case, the alleged radiative forcing of the enhanced greenhouse effect. They did not prove the “enhanced greenhouse effect,” though. They simply assumed its presence and observed the same gas properties that Tyndall showed more than 165 years earlier.
Another scientific principle that demonstrates whether a theory is sound is the lack of any other plausible explanation. This principle doesn’t appear to apply to the “enhanced greenhouse effect” that is central to AGW theory.
Many physicists and astrophysicists, such as Joseph Postma, and other scientists have offered other plausible explanations. For example, Holmes 2018 suggested that surface temperature could also be maintained through nothing more than the effects of atmospheric pressure and thermal convection within the troposphere:
[. . .] it is proposed that the residual temperature difference between the effective temperature and the measured near-surface temperature, is a thermal enhancement caused by gravitationally-induced adiabatic auto-compression, powered by convection. A new null hypothesis of global warming or climate change is therefore proposed and argued for; one which does not include any anomalous or net warming from greenhouse gases in the tropospheric atmospheres of any planetary body.
Two climate scientists, Ned Nikolov and Karl Zeller, achieved some infamy for publishing papers under pseudonyms. Earmarked as “climate deniers,” they couldn’t even get their papers submitted for peer review, let alone published in “respected” journals. In 2014, they decided to publish using pen names. This time their papers were peer-reviewed, then published. The papers were subsequently withdrawn, not for any scientific reason but because their necessary use of aliases was discovered. In response, Karl Zeller observed that “disagreeing with current greenhouse effect theory does not constitute an error.”
In 2017, these two climate scientists published the paper Nikolov, Zeller (2017), which offered a model for calculating the mean global temperature for the surface of a solid planet with or without an atmosphere. They applied their model to Mars, Venus, Triton (a moon of Neptune) and Titan (a moon of Saturn) and claimed their model proved accurate.
Crucially, their model relied upon calculated surface air pressure and solar radiation to estimate mean global temperature. Their model implies that the chemical composition of an atmosphere does not control the surface temperatures of a planet. In the abstract for their 2017 paper, the scientists wrote:
[. . .] the atmospheric ‘greenhouse effect’ currently viewed as a radiative phenomenon is in fact an adiabatic (pressure-induced) thermal enhancement analogous to compression heating and independent of atmospheric composition. Consequently, the global down-welling long-wave flux presently assumed to drive Earth’s surface warming appears to be a product of the air temperature set by solar heating and atmospheric pressure. In other words, the so-called ‘greenhouse back radiation’ is globally a result of the atmospheric thermal effect rather than a cause for it.
Questioning AGW Theory Warming
A core element of AGW theory is the notion that humanity’s CO2 emissions are causing “additional” and “unprecedented” global warming. For that to be proved, there must be some empirical evidence that the rise in atmospheric CO2 precedes any measurable warming. There doesn’t appear to be any proof, however.
It is commonly acknowledged that there is no paper anywhere in science that proves the existence of the AGW mechanism using nothing but empirical data. Instead, the imaginary link between humanity’s GHG emissions and climate change is based upon a complex network of interdependent theories, computer models and projections. Yet, making empirical measurements of such things as the average “surface air temperature” (SAT) is highly problematic.
As Rob Jeffrey observed:
Almost all scientists believe that natural forces have driven long-term climate change in the past. The earth’s history shows that climate change is a process taking place for over four billion years. There would appear to be broad agreement that long-term climate change cycles are driven by the Milankovitch cycles, the history of which is well recorded.
The Milankovitch cycles describe the major orbital cycles of Earth as both the shape of Earth’s solar orbit and its “axial tilt” fluctuate relative to the sun. The orbital cycles cause Earth to receive varying intensities of TSI (Total Solar Irradiance). Over time, TSI is part of the natural variation that impacts the climate.
The “official” Intergovernmental Panel on Climate Change (IPCC) climate science concedes that historical temperature proxy records, such as ice cores, show that there is a lag, possibly of up to 800 years, between the initiation of global warming and rising atmospheric C02. Caillon et al. (2003), noting that interglacial warming appears to initiate in the southern hemisphere, found:
The sequence of events [. . .] suggests that the CO2 increase lagged Antarctic deglacial warming by 800 (+ or – ) 200 years and preceded the Northern Hemisphere deglaciation. CO2 is not the forcing that initially drives the climatic system during deglaciation [warming].
Shakun et al. (2012) developed a “computer model,” which the authors claimed explains what happens next from an AGW theory perspective. This has been reported by, among others, Skeptical Science:
In short, the initial warming was indeed triggered by the Milankovitch cycles, and that small amount of orbital cycle-caused warming eventually triggered the CO2 release, which caused most of the glacial-interglacial warming. So while CO2 did lag behind a small initial temperature change (which mostly occurred in the Southern Hemisphere), it led and was the primary driver behind most of the glacial-interglacial warming.
To be clear: AGW theory posits that the sun, which is only apparently capable of heating Earth’s surface to -18°C, starts the process of glacial-interglacial global warming. The theory then assumes a kind of naturally occurring enhanced greenhouse effect, in which “additional” released GHGs—notably CO2 from the oceans—trap the heat, causing “positive feedback.” Supposedly this process, in turn, exacerbates global warming. This is said to explain why historical C02 and temperature records appear to show that the increase in atmospheric CO2 does not cause global warming and simultaneously demonstrates why CO2 does cause global warming.
As Skeptical Science puts it:
Thus while the initial warming hasn’t historically been caused by CO2, CO2 has amplified the warming for thousands of subsequent years, and thus is still the principal control knob governing Earth’s temperature.
AGW theory reportedly suggests that CO2 is the “principle control knob” and claims that, while the sun is the power switch, it is not the power supply. Radiative forcing appears to produce significant amounts of additional atmospheric heat energy, according to AGW theory.
The problem with this idea is that global temperatures have reportedly been historically as high—if not higher—than they are today, and yet CO2 levels were lower during those warm periods.
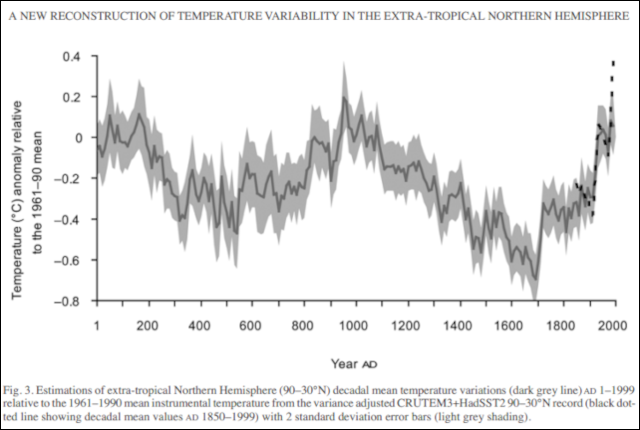
For example, by sampling mercury levels in peat bogs as a climate proxy, Martinez-Cortizas et al. (1999) showed that the climate in northwest Spain was, on average, 1.5°C warmer during the Medieval Warm Period (c 950 to c 1250) and possibly up to 2°C warmer during the Roman Warm Period (c 250 BCE to c 400 CE) when compared to the stated modern average (1968–1998) at the time of publication.
These findings correlate with numerous other studies that show these warmer periods, when CO2 was relatively low. For example, Desprat et al. (2003) used pollen levels from core samples taken from the Iberian peninsula that also show both the Roman and Medieval warm periods. This is evidence that seemingly contradicts both the notion of unprecedented modern global warming and AGW theory.
Ljungqvist (2010) took multiple proxies from across the northern hemisphere to reconstruct historical temperatures. Again, these show both the Roman and the Medieval warm periods. During these periods, according to AGW theory proponents like NASA, atmospheric CO2 levels did not eclipse 280 parts per million (ppm).
This kind of empirical evidence has led many scientists, including Rob Jeffrey, to question AGW theory in its entirety:
There is strong evidence that non-atmospheric culprits, for example, the sun, are primarily responsible for global warming and any climate change.
For example, Soon et al. (2015) found:
Using thermometer-based air temperature records for the period 1850–2010, we present empirical evidence for a direct relationship between total solar irradiance (TSI) and the Equator-to-Pole (Arctic) surface temperature gradient (EPTG). [. . .] Overall, evidence suggests that a net increase in the TSI, or in the projected solar insolation gradient which reflects any net increase in solar radiation, has caused an increase in both oceanic and atmospheric heat transport to the Arctic in the warm period since the 1970s [. . .].
In 2018, atmospheric scientist Rex J Flemming Ph.D noted:
Many believe and/or support the notion that the Earth’s atmosphere is a “greenhouse” with CO2 as the primary “greenhouse” gas warming Earth. [. . .] There is now a much clearer picture of an alternative reason for why the Earth’s surface temperature has risen since 1850. There is a thermal blanket or buffer for atmospheric surface conditions that has been in existence for the past billion years [. . .]. Its exact form depends on the effective solar energy reaching the Earth’s surface. The sources of the thermal blanket and the subsequent transfer of heat upward are from three forces: the Earth’s gravitational field with its impact on convection, the condensation of water vapor (H2O), and the radiation effects of the two primary atmospheric trace gases of H2O and CO2. It will be demonstrated that the radiative roles of H2O and CO2 are relatively minor.
Jeffrey highlights the work of Professor Valentina Zharkova, an astrophysicist who has been the lead author of numerous papers demonstrating how variable solar activity effects the known TSI impacts of the orbital cycles. Zharkova has identified many solar cycles, some as short as 11 years in duration. She has shown how these solar activity cycles either enhance or counteract the TSI effect of the major orbital cycles:
This approach revealed a presence of not only 11-year solar cycles but also of grand solar cycles with a duration of 350–400 years. [. . .] These grand cycles are always separated by grand solar minima of Maunder minimum type, which regularly occurred in the past, forming well-known Maunder, Wolf, Oort, Homeric, and other grand minima. During these grand solar minima, there is a significant reduction of the solar magnetic field and solar irradiance, which reduce terrestrial temperatures.
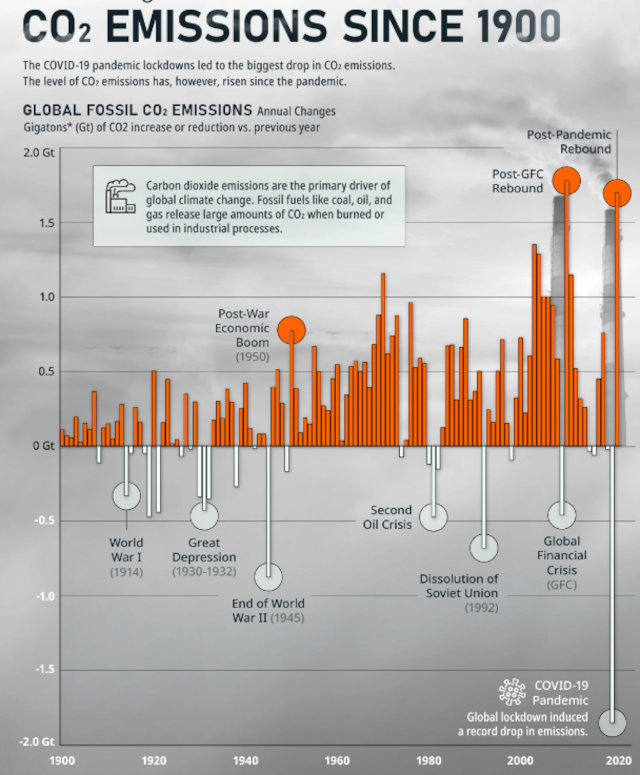
Globally, the planet is in a warming interglacial phase after emerging from the Little Ice Age that ended in the mid-19th century. With regard to recent warming, if we look at the data from the US National Oceanic and Atmospheric Administration (NOAA) temperature records set across all US states since 1890, the hottest decade in the US was the 1930s.
AGW theory states that it is man-made CO2 emissions from burning fossil fuels that have strongly exacerbated global warming. The bulk of these emissions are said to have occurred in the post-WWII period. Which begs the question: why were the 1930s the hottest decade of the 20th century in the US if CO2 levels rose markedly after WWII?
The Thames periodically froze solid during the Little Ice Age—perhaps most regularly during of the solar Maunder minimum [c 1645–c 1715]. Even relatively recent global warming began prior to the notable post-WWII increase in man-made CO2 emissions. If it hadn’t, Londoners would still have been holding frost fairs on the frozen Thames in the 1920s.
It seems likely that global temperature rises over the last few centuries have been a result of the earth absorbing more shortwave solar radiation due to lower cloud albedo. The warming of the planet in the last 20 years is apparently due to the higher ultraviolet permeability of clouds. The degree of infrared radiative forcing, allegedly caused by the so-called greenhouse effect, appears negligible.
Dübal and Vahrenholt. (2021) stated:
We found the declining outgoing [reflected] shortwave radiation to be the most important contributor for a positive TOA (top of the atmosphere) net flux of 0.8 W/m2 in this time frame. [. . .] We compare clear sky with cloudy areas and find that changes in the cloud structure should be the root cause for the shortwave trend. [. . .] The drop of cloudiness around the millennium by about 1.5% has certainly fostered the positive net radiative flux. [. . .] This leads together with a reduced incoming solar of −0.17 W/m2 to a small growth of imbalance of 0.15 W/m2. We further present surface flux data which support the strong influence of the cloud cover on the radiative budget.
These findings were corroborated by a NASA research team whose paper, Loeb et al. (2021), made the case that 21st century warming was “primarily due to an increase in absorbed solar radiation associated with decreased reflection by clouds and sea-ice.” This is a reference to the observed reduction in planetary albedo.
Similarly, Professor Antero Ollila found that the “SW [shortwave] anomaly forcing was the major reason for this temperature increase. SW anomalies have had their greatest impacts on the global temperature during very strong (super) El Niño events in 1997–98 and 2015–16.”
Consequently, Rob Jeffrey noted:
The earth’s orbit causes these cycles around the sun, the different periods of the Earth’s Eccentricity cycle, the Obliquity cycle and the Precession of Equinoxes. Until the last 200 years, any significant climate change has been naturally driven [. . .], it is believed by many experts that these shorter-term cycles are driven by solar cycles. [. . .] These are caused by fluctuations in the solar flux [incoming shortwave radiation measured in W/m2], affecting cosmic ray penetration and cloud formation in the earth’s atmosphere leading to warming and cooling periods. [. . .] The remaining question is how much humans currently contribute to short-term global warming. Earth has been in similar short-term natural warming phases eight times over the last 11,000 years.
Questioning The Impact of Human CO2 Emissions
Perhaps the arguments we have explored here and in Part 1 show little more than scientific debate. However, even if we accept how the “enhanced greenhouse effect” is supposed to work, there is still further reason to question the AGW theory.
As Rob Jeffrey stated:
Even if CO2 is scientifically proven to cause some global warming, there is significant evidence indicating that human-made CO2 is only a tiny part of the overall global CO2 generated.
The atmosphere contains approximately 78% nitrogen, 21% oxygen and about 0.9% argon. The remaining 0.1% consists of carbon dioxide, nitrous oxides, methane and ozone. In addition, water vapour (H2O) is a notable variable. Some AGW theorists claim that greenhouse gases make up 1% of the atmosphere, but argon is not a greenhouse gas, so that doesn’t appear to be true.
Adding complexity, water vapour readily condenses into a liquid and evaporates back to a gas in the atmosphere. Its transient nature means it can account for up to 3% of total atmospheric gases.
As is often reported, atmospheric CO2 currently constitutes more then 400 ppm of the atmosphere. That equates 0.04% of total atmospheric gases. This suggests that CO2 accounts for about 40% of GHGs, if we temporarily discount water vapour. According to the US Energy Information Administration (EIA), throughout the 1990s, of an estimated annual average of 793 billion metric tons (bmt) of atmospheric CO2, approximately 23 bmt were the result of annual human emissions.
This suggests that human CO2 emissions accounted for about 3% of all atmospheric CO2 at the end of the last century. Human CO2 emissions have continued to increase during the first two decades of the 21st century. A current average of around 35 bmt, about 4.5% of total CO2 emissions, isn’t unreasonable. Consequently, human CO2 emissions appear to represent approximately 1.8% of all GHGs. H2O content is a variable that impacts this figure.
The climate scientists who write at Skeptical Science state that the human-induced enhanced greenhouse effect is the “principal control knob governing Earth’s temperature.” Unfortunately, if we radically transform every aspect of our lives and somehow manage to reduce human CO2 emissions to zero (which isn’t possible unless we go extinct), at least the 98.2% of annual global emissions of GHGs would seemingly remain.
This situation is further complicated by water vapour, which can contribute 80% of GHG by mass and 90% by volume—thus supposedly increasing the total alleged GHGs in the atmosphere. NASA states that water vapour is, by a considerable margin, the dominant GHG:
Water vapor is known to be Earth’s most abundant greenhouse gas. [. . .] [Researchers] used novel data from the Atmospheric Infrared Sounder (AIRS) on NASA’s Aqua satellite to measure precisely the humidity throughout the lowest 10 miles of the atmosphere. That information was combined with global observations of shifts in temperature. [. . .] Water vapor is the big player in the atmosphere as far as climate is concerned.
The variation of atmospheric H2O gas is said to be a product of the greenhouse effect, which causes further evaporation. Water vapour supposedly accounts for between 66% and 85% of the overall “greenhouse effect.” Crucially, in AGW theory, water vapour “does not cause global warming.” Apparently, while it is by far the most influential GHG, it does not constitute a “forcing” GHG. “Radiative forcing” is reserved for other GHGs, such as CO2 and, to a much lesser extent, CH4 (methane).
If we accept that up to 90% of GHG by volume is water vapour, then this reduces the human emission of CO2 to about 0.3% of total GHGs, leaving 99.7% of GHGs to contend with if we achieve “net zero” emissions.
As AGW theory rejects the notion that climate change is caused by the sun, it also largely dismisses the extent to which clouds alter the absorption of solar radiative flux. This means the alleged “radiative forcing” of greenhouse gases includes water vapour as a passive product of the “forcing” GHGs but excludes cloud cover as a significant variable for any corresponding “climate change.”
The IPCC explains this by stating that primarily human CO2 emissions, which represent about 0.3% of GHG’s (if we include water vapour), have a “net warming” effect, while water vapour, in its entirety, doesn’t. This is supposedly because CO2 has a much longer “residence time” in the atmosphere.
As noted by the EIA, of the total 793 bmt of emitted CO2, from both natural and human sources, 781 bmt were re-absorbed by the planet—via trees, oceans, weathering, etc.—in the same period. This emission and absorption rate between carbon “reservoirs,” such as forests, mountains and oceans, is called the carbon cycle. The carbon “sink” is the measured amount of CO2 that is absorbed or emitted by the reservoir per unit of time. This is measured, for example, in kilograms of CO2 per day—kg C/day.
We have critically scrutinized this [carbon] cycle and present an alternative concept, for which the uptake of CO2 by natural sinks scales proportional with the CO2 concentration. In addition, we consider temperature dependent natural emission and absorption rates, by which the paleoclimatic CO2 variations and the actual CO2 growth rate can well be explained. The anthropogenic contribution to the actual CO2 concentration is found to be 4.3%, its fraction to the CO2 increase over the Industrial Era is 15% and the average residence time is 4 years.
Noting this, Rob Jeffrey added:
The residence time of CO2 in the atmosphere is critical, as the longer, it remains in circulation, the longer any purported artificial imbalance will exist. The IPCC position (unproven) is that CO2 atmospheric residence time is 100+ years. Further evidence indicates that the CO2 atmospheric residence time is more like ten years (or less) — an extraordinarily significant difference with major ramifications.
This observation is entirely contrary to the claims of the IPCC and other promoters of AGW theory. Certainly, with regard to the IPCC, the fact that such findings are seemingly ignored may be due to political bias. We will cover that point in Part 3.
Questioning the AGW Computer Models
The reason the climate scientists insist that AGW is settled science, apart from the fact their funding is largely dependent upon them saying so, is that all the AGW theory-based “climate models” are offered as if they are evidence supporting the theory. However, their models are dependent upon the AGW theory.
Even if subsequent measurements are congruent with the model, unless other explanations have been discounted, the model still doesn’t “prove” the theory. As Jeffrey, Clauser, Postma, Soon, Flemming, Lindzen, Giaever, Dyson, Curry, Spencer, Coombs and many other sceptical scientists and other sceptics have tried to highlight, not only is it illogical to claim a model “demonstrates” a theory, but the AGW theory computer models frequently appear to be either biased or just plain wrong in any event.
Given that stratospheric cooling has been observed, according to Dr. Hossenfelder and other climate scientists, concordance with Manabe and Wetherall’s 1967 model—see Part 1—“proves” AGW theory and supposedly dispels the notion that a change in solar radiation has anything to do with recent global warming. It is instead caused by an “enhanced greenhouse effect,” the AGW proponents say. As mentioned in Part 1, Santer et al. (2023) claims to have detected the supposedly undeniable AGW theory “fingerprint.”
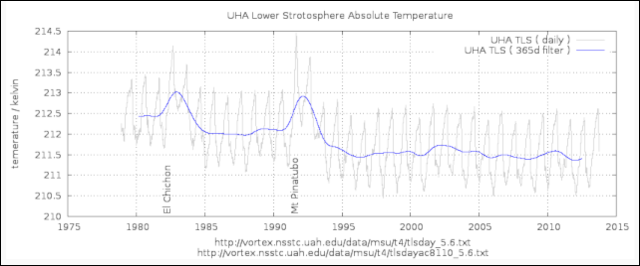
When looking at the signals in the mid-to-upper stratosphere, Santer et al. (2023) noted that the 1991 Mount Pinatubo eruption caused stratospheric warming but that after the initial warming period the volcanic eruption “augments the gradual anthropogenically induced stratospheric cooling.” It should be noted that this is the observed augmentation of an unproven theoretical effect.
Satellite data from the University of Alabama shows the volcanic stratospheric warming and subsequent cooling effects following both the El Chichon (1982) and Mount Pinatubo (1991) eruptions.
After each eruption, stratospheric temperatures settled lower than they were prior to each eruption. Rather than a monotonic linear temperature decline, the data indicated that volcanic activity led to a marked downward step in stratospheric temperatures. In 2009, the US National Center for Atmospheric Research wrote that “the stratospheric changes are not monotonic [not consistently linear in a single downward trajectory], but more step-like in nature.”
In January 2022 the the underwater Hunga Tonga-Hunga Ha-apai volcano erupted. Sellito et al. (2022) said of it:
We find that the Hunga Tonga-Hunga Ha-apai eruption produced the largest global perturbation of stratospheric aerosols since the Pinatubo eruption in 1991 and the largest perturbation of stratospheric water vapour observed in the satellite era. [. . .] The likely stratospheric ozone depletion due to aerosol and water vapour injections might produce a large additional cooling of the stratosphere.
Ozone (O3) has a heating effect in the stratosphere, as noted by NASA in 2004:
Ozone generates heat in the stratosphere, both by absorbing the sun’s ultraviolet radiation and by absorbing upwelling infrared radiation from the lower atmosphere (troposphere). Consequently, decreased ozone in the stratosphere results in lower temperatures. Observations show that over recent decades, the mid to upper stratosphere (from 30 to 50 km above the Earth’s surface) has cooled by 1° to 6° C (2° to 11° F).
The stratospheric cooling potentially caused by the Hunga-Tonga eruption was clearly observed by Schoeberl et al. (2023). This and earlier findings following the El Chichon and Mount Pinatubo events suggest that stratospheric cooling is more than just “augmented” by volcanic activity. It cannot be ruled out that volcanic eruptions are, in fact, a significant driver of ozone depletion and, therefore, stratospheric cooling.
The other aspect of the claimed AGW theory “fingerprint” is that stratospheric cooling occurs concurrently with tropospheric warming, all allegedly caused by the “enhanced greenhouse effect.” But lower planetary albedo results in more shortwave “ultraviolet” radiation warming the earth. Data from NASA’s CERES EBAF readings suggest that Earth’s albedo, particularly in the northern hemisphere, which has far greater “blackbody” land mass, has reduced significantly over the last 20 years.
In addition, ozone depletion, cooling the stratosphere, also increases the amount of ultraviolet (UV) radiation that reaches Earth’s surface. This, combined with reduced albedo, suggests the Earth is absorbing more solar shortwave “ultraviolet” radiation, warming the planet. Volcanic ozone depletion has evidently contributed to the process.
Santer et al. (2023) stated that from 1986 to 2022 human-produced greenhouse gases caused warming of Earth’s surface. Data from CERES EBAF and evidence from Schoeberl et al. (2023), among others, suggest warming caused by increased solar radiative flux. The surface could be warmed by the sun and the stratosphere could cool as a result of natural variability.
Seen from this perspective, there is no conclusive AGW theory “fingerprint,” as claimed by some “climate scientists.” Manabe and Wetherall’s 1967 model simply offers another possible explanation.
We might also question both the degree and the pattern of tropospheric warming alleged in the AGW climate models. For example, Mitchel et al. (2020) found evidence of consistent bias in the AGW climate models that tended to exaggerate both tropospheric warming and stratospheric cooling:
[. . .] we find considerable warming biases in the CMIP6 [Coupled Model Intercomparison Project] modeled trends, and we show that these biases are linked to biases in surface temperature. We also uncover previously undocumented biases in the lower-middle stratosphere: the CMIP6 models appear unable to capture the time evolution of stratospheric cooling, which is non-monotonic.
Jain et al. (2023) have suggested the reason AGW models are frequently at odds with the empirical data is because of poorly understood “internal variability”:
The scientific literature presents many examples where a mismatch between model and observed climate features has been reported, such as trends in regional rainfall amount and temperature, multidecadal changes in atmospheric circulation and climatology, the frequency or magnitude of extreme events [. . .] or external forcing effects. There can be many reasons why models disagree with observations. However, [. . . ] a lack of agreement between the modeled and observed climate can still arise simply due to chaotic internal variability
Ayer et al. (2021) defined internal variability as “the natural variability of the climate due to its chaotic and nonlinear nature.” The IPCC concedes that the climate is a chaotic system that defies accurate prediction:
The climate system is a coupled non-linear chaotic system, and therefore the long-term prediction of future climate states is not possible. Rather the focus must be upon the prediction of the probability distribution of the system’s future possible states by the generation of ensembles of model solutions.
The fact that “long-term prediction of future climate states” is, according to the IPCC, impossible, rather undermines all the current “climate alarm” about what the climate will be like in a hundred or two hundred years. Perhaps “the generation of ensembles of model solutions” can predict “the probability distribution” of likely future climate states, but nearly all the models referenced by the IPCC are constructed solely from a AGW theory. They could all be fundamentally flawed.
“Equilibrium climate sensitivity” (ECS), in accordance with AGW theory, is defined in Sherwood et al. (2020) as “the steady-state global temperature increase for a doubling of CO2.” The Sherwood paper offered an AGW theory-based ECS model. It was extremely influential in the IPCC’s 6th Assessment Scientific Report (AR6), published in 2021.
Hitherto, the IPCC ARs claimed that doubling in C02 would cause somewhere between 1.5°C and 4.5°C of “global warming.” This changed in AR6, largely thanks to the Sherwood model, to a claim that the ECS would allegedly lead to 2.5°C of warming or maybe up to 4.5°C, or perhaps 5°C.
When independent researcher and mathematician Nic Lewis checked the methodology of the Sherwood paper, cited more than twenty times by the IPCC, he claimed to have found significant errors, inconsistencies and other mathematical shortcomings. Using the same dataset but different analysis techniques, Lewis found that ECS leading to “between 1.5 °C and 2 °C” warming—considerably lower than the Sherwood-influenced IPCC claims.
Dr. Roy Spencer is a former Principal Research Scientist at the University of Alabama in Huntsville and Senior Scientist for Climate Studies at NASA’s Marshall Space Flight Center. He is currently team leader for the Advanced Microwave Scanning Radiometer on NASA’s Aqua satellite. Dr. Spencer contends that climate sensitivity—that is, the suggestion that man-made CO2 emissions are causing an “enhanced greenhouse effect”—overlooks internal variability to such an extent that the “enhancement” is virtually undetectable.
Consequently, Spencer is called a climate denier by the legacy media. Nonetheless, Dr. Spencer boldly declares:
Global warming” refers to the global-average temperature increase that has been observed over the last one hundred years or more. But to many politicians and the public, the term carries the implication that mankind is responsible for that warming. [. . .] Figuring out how much past warming is due to mankind, and how much more we can expect in the future, depends upon something called “climate sensitivity” [ECS]. [. . .] You would think that we’d know the Earth’s ‘climate sensitivity’ by now, but it has been surprisingly difficult to determine.
Wikipedia tells us:
In technical terms, climate sensitivity is the average change in global mean surface temperature [GMST or just GST] in response to a radiative forcing
The GST is currently calculated by averaging the temperatures anomalies of the oceans, known as the sea surface temperature (SST) and the surface temperature anomalies of continents, known as the surface air temperature (SAT). These are absolutely essential inputs into the AGW theory “climate sensitivity”-based models.
NASA’s Goddard Institute for Space Studies (GISS) provides the IPCC with “estimates” for the SAT, which is the air temperature within about 2m above Earth’s surface. The so-called “GISTEMP analysis” provides one of the four key dataset inputs into the IPCC’s favoured AGW theory models. When considering what the SAT is and how to measure it, GISS stated, in a December 2016 article, that it
[. . .] doubt[s] that there is a general agreement how to answer this question. [. . .] To measure SAT we have to agree on what it is and, as far as [GISS] know, no such standard has been suggested or generally adopted.
In terms of working out the SAT component of the GST, GISS added:
Again, there is no universally accepted correct answer. Should we note the temperature every 6 hours and report the mean, should we do it every 2 hours, hourly, have a machine record it every second, or simply take the average of the highest and lowest temperature of the day? On some days the various methods may lead to drastically different results.
GISS has more recently updated its thoughts on this issue. It now states:
SAT varies quite substantially and so this number is not necessarily reflective of a broader area average. SAT maps can only be created using a model of some sort. [. . .] In the global average, this variation is around 0.5°C
and:
[. . .] different approaches can give systematically different answers depending on the specifics of the weather that day. [. . .] [D]ifferent models will produce slightly different estimates of the SAT. [. . .] Statistical approaches (such as used by Jones et al. (1999)) have a similar uncertainty.
To be clear: there is no universally accepted, systematic methodology even to calculate the current average SAT of Earth. Yet nearly all AGW theory-based models rely upon calculated SAT for the input “climate sensitivity.”
Santer et al. (2021) (not 2023) showed that between 1988 and 2019 the observed sea surface temperature (SST), tropospheric temperature, and total tropospheric water vapour showed less tropical warming than predicted by the AGW theory climate models. The conclusion was not that the AGW theory computer models could possibly be awry but that the “large uncertainties in observations” needed to be accounted for.
The legacy media exploited the Santer paper to amplify climate alarm by reporting that satellite readings had underestimated global warming for 40 years. While this is not what the paper said, it could certainly be inferred from it—and so that’s the story that was told.
Upon examining that Santer et al. (2021) paper, Dr. Roy Spencer noted:
I conclude that there is nothing new in the paper that would cast doubt on the modest nature of tropospheric warming trends from satellites — unless one believes climate models as proof, in which case we don’t need observations anyway. [. . .] [T]he Santer et al. study [is] largely consistent with the view that global warming is proceeding at a significantly lower rate that is predicted by the latest climate models, and that much of the disagreement between models and observations can be traced to improper assumptions in those [AGW theory] models.
Recently more than 1,800 signatory scientists, academic researchers and other AGW theory sceptics, including Nobel Laureate scientists, issued a joint statement:
To believe the outcome of a climate model is to believe what the model makers have put in. This is precisely the problem of today’s climate discussion to which climate models are central. Climate science has degenerated into a discussion based on beliefs, not on sound self-critical science. Should not we free ourselves from the naive belief in immature climate models?
We are supposed to believe that the science on the climate is settled. We are also supposed to believe that questioning “the Climate Science”™ constitutes some sort of heresy. The UN and its IPCC and other “intergovernmental” bodies demand that we unreservedly agree with whatever they tell us. If we don’t go along, they accuse us of engaging in a form of hate speech.
As we shall discuss in Part 3, the IPCC and other proponents of AGW theory have gargantuan conflicts of financial interest. Public and private institutions and organisations that push AGW theory have a clear political agenda that has little to do with addressing any environmental concerns. Their agenda also includes no obvious basis for “climate alarm.”
In Part 3 we explore the evidence that suggests the narratives we are given about the alleged “climate emergency” are nothing more than propaganda.


1
‘UN spreads disinformation globally’
Inadvertently assisted by us e.g. not noticing omission of tiny words, inserting words into empty space between words, mis-interpreting meaning of words etc.
e.g. ‘surprise attack’ 7 October did surprise public globally; not necessarily intended surprise anyone else, just part of 4 years’ attacks on us. ‘Alt media’ spreads other interpretations.
2
“enhanced greenhouse effect” assumed
Far too few with mind-set needed for scientific research since 1990s, so recruiters meet their targets by recruiting those who can’t research.
Experiments designed to prove self correct or others incorrect get false negatives and false positives. Experiments’ titles ‘to prove’, ‘show’, ‘proof of’ – fake science.
Whereas, ‘to study’, ‘investigate’ aim for accuracy – unbiased; avoids assumptions because assumptions are generalisations and generalisations are inaccurate.
3
‘Theory is sound … lack of any other plausible explanation.’
No – that’s mis-leading, arrogant garbage.
Human fallibility is always plausible explanation for only one plausible theory.
Right/wrong assessment depends on criteria used: unbelievably right result believed wrong until ask if established theory incorrect.
Press never hear tiny word ‘if’ that’s hall-mark of real scientists.
4
‘human-made CO2 only tiny part’
But ‘selfies’ graphically show desire to be all, end all, know it all and learn nothing.
Technology measures ever tinier amounts; not necessarily significant. Measurement often within equipment’s inherent ‘electronic noise’ range but saying so dissatisfies politics and funders.
5
‘Atmospheric CO2 … 0.04% total atmospheric gases’, ‘human CO2 emissions about 3% all atmospheric CO2’
3% of 0.04% not worth calculating let alone attempt to measure.
6
‘natural variability’
Nature is a continuum but computers cannot do continuum so computers are a liability in research into natural world; climate or biological.
Digitalisation tries to force nature to fit inappropriate tools, corrupting data by excluding large chunks of real world and bundling different chunks as if same i.e. put ‘garbage in’, escalate with algorithms, then fly-tip ‘garbage out’ with models.
IT cannot cope with life’s variety; so ruthlessly eradicating it.
7
‘“demonstrates” theory’
‘Demonstrate’, ‘show’ or ‘prove’. If model proves theory, say ‘proves’; evaded by equivocal ‘demonstrates’.
No case to answer; models show what programmed to show i.e. theory, correct or otherwise – computers do as told no matter what.
8
‘No universally accepted’
Many everyday rows entirely due to not clarifying what talking about in first place.
Man made global warming is a dangerous idea because so many activities generate CO2 justifications can be made for disastrous policies on the basis CO2 emissions must be reduced. Coal fired power stations produce reliable electricity but as they produce CO2 they must be closed down and replaced with unreliable wind and solar power. aviation enables people to travel the world and aviation is critical to the world economy. As planes produce CO2 we should stop flying or fly less which means we can no longer travel abroad and if aviation went the economic impact would be devastating eg the tourist trade would be devastated if people could no longer fly. Cars give people freedom to travel and as cars produce CO2 it is argued car usage should be reduced which we seen in policies such as ULEZ and replacing ICE vehicles with electric vehicles. Reducing CO2 emissions can result in increased taxes and attacks on our living standards.
Just Stop Oil have used man made climate change to make absurd demands such as phasing out fossil fuels which are essential for modern society to function and protests which involve blocking traffic, damaging property and disrupting sporting events. CO2 reduction policies means taking us back to the pre industrial age and removing things such as reliable energy and transport which have improved our lives. In view of this it is essential we question the science behind man made global warming.
Thanks Ian. I couldn’t agree more.
Hey,
This can not possibly be all the comments? I don’t mean to accuse, but I know you are pretty well read (in both interpretations of that phrase). It’s hard to believe that there are so few comments on both sides of this debate. I noted that in part one as well.
I hate to admit it, but much of the theoretical arguments are a bit over my head (figuratively and literally), especially in regard to the relationship and relativity of the stratospheric cooling to the overall climate change theory. Also your “figure 1” of part one (which probably should have been labeled “figure 2” as you did have a graphic inserted above that) left me feeling stupid as well as feeling either you or the ones that generated it (or both) have misinterpreted the data or it’s representation. If your interpretation is correct, and if indeed this is integral to AGW theory, then this needs to be addressed immediately, as it makes no sense.
I’m willing to cede that point to my misunderstanding or lack of knowledge. What I do have an (basic) understanding of, is the geological, solar and astronomical cycles that influence temperature. Although I can’t recall the exact number of cycles (between 5-10), or their names, they vary between 11 and 180,000 years. If you look at a graph with an appropriate time span (which is very hard to find, but I include a link to a very basic one below)
https://storage.googleapis.com/climate-science.appspot.com/en-v5/C0_2-Details-2-ice_ages.png
you will see that we are actually below the anticipated peak of an approximate 120,000 year cycle. Every other graph I could find was of a much shorter timeline. When you leave out this critical information, it alters the relativity and perception almost 180 degrees (geometric not thermal). It also seems presumptuous to give a molecule with such a low percentage in the composition of the atmosphere, especially when compared to water, such a high significance to the overall complexity of the equation. Again, especially if you are going to ignore water in that equation.
Just my not so humble, opinion.
Thanks Devil’s Advocate.
No it makes no sense at all. Which I am glad is the impression you took away from reading that part of the piece. It makes no sense to me either.
I digressed from my original point though, which was…
“Really? this is all the comments?”
Is everyone sleeping (or actually busy) because of the holidays?
I am afraid so. You can read more comments for the post at OffGuardian who have kindly republished the articles.
https://off-guardian.org/2023/12/20/climate-change-the-unsettled-science-part-1/
https://off-guardian.org/2023/12/28/climate-change-the-unsettled-science-part-2/
Hey,
One last time, I left you a one time Etherium instead of a subscription because it’s anonymous and saves me international transaction fees every month. But more importantly, I found this site for historical weather data and interactive, freely reproducible graphs.
https://www.temperaturerecord.org/
There’s an icon on the upper left side that blows it up to 800,000 years and you can zoom in on specific portions and overlay CO2 or other variables and even add it to a website.
Many thanks and for your other message which have I not shared. Really appreciated and thanks for the link.
I am a 76-year-old man who has been in the welding profession for 59 years. I started as a weldor. I owned a welding business, became a welding instructor, a welding sales representative, a senior welding inspector, a welding consultant, and a welding technical representative for Canadian Liquid Air Today it is known as Air Liquid. This company was the first in 1897 to compress and cool air down to minus 297.7 degrees F. to tap off liquid oxygen. So, I will state that they know a little bit about atmospheric gases
The air we breathe contains 21 percent Oxygen (O2) 78 percent Nitrogen (N2) and 1 percent other rare gases like Argon, Neon, Krypton, Helium, Hydrogen, traces of H2O, and Carbon Dioxide (CO2). Air Contains 0.04 percent CO2. Please let that sink in for a minute. We are told when searching on the internet that we are releasing 9,5 billion metric tons of carbon into the atmosphere. First of all, we are talking about atomic carbon which has a radius of 0.0914 nm. Secondly, how are we separating the carbon from the CO2 compound/molecule? The welding industry uses dry CO2 as a shielding gas. In the intense heat of the ionized CO2, the CO2 is broken up into Carbon Monoxide (CO) and Oxygen (O2). So, where is this 9.5 billion metric tons of carbon? By the way, CO2 is heavier than air. CO2 is essential to life on Earth. Without photosynthesis, we would not be here. It is a known fact that the climate is changing all the time and it is affected by the Sun, Moon, Ocean Currents, Axis of the Earth, and our human behavior. Please see this: https://www.globalresearch.ca/our-world-how-we-behave-it/5811025
Dave
I agree Dave. That’s why I wrote the posts.
“… are nothing more than propaganda.”
This is exactly what you fuckheads do!!! You’re wrong in every single aspect!!! Thus, shove your stupid climate bullshit propaganda up your fucking ass and shut up, shitheads!!!
Say it like you mean it Derek. Say it like you mean it.
my parents neighbor of their spanish holiday house is a dutch “greenhouse landlord” and he says that none of his commercial greenhouses heats up when they get flooded with CO2 during noon to promote most efficient plant growth (he would love heat them that way during cold but sunny winter seasons, but nope, does not work out) – i am pretty sure science & politics know this very well, but ummm, taxation & control is just too desirable to face the truth, give up propaganda and plant trees (which then could produce unwanted oxygen for todays voters depleted brains)
Thanks.
Hi Ian,
The post says we are in a warming phase but the Grand Modern Solar Minimum started in 2020 and it will get quite cold
https://www.ncbi.nlm.nih.gov/pmc/articles/PMC7575229/
Also, the global warming narrative was started by the Club of Rome admitted in their minutes
https://substack.com/profile/71628511-proton-magic
Honestly I think people get lost in and can argue forever about the details. They said they made it up and there is no sign of a climate crisis except the coming little ice age. You are great but short to he point posts get better understanding. The long info you can link to as an appendix.
Thanks. Yep I think the point about the CoR statement and plan can be made irrespective of their rather silly computer model predictions. The issue is that they sort to exploit the narrative for social and political control.
Sorry, this is the correct Club of Rome Link
https://protonmagic.substack.com/p/deadly-blow-to-the-addams-family
hi iain, i just noticed i forgot to insert “with co2” between “when they get flooded […] during noon to promote…” – could you please add/insert it so that other readers can easily understand this simple “reality-check” of the non-heating properties of co2 & greenhouses?
Thanks, done.